From Better Evaluation
Causal mapping helps make sense of the causal claims (about "what causes what") that people make in interviews, conversations, and documents. This data is coded, combined, and displayed in the form of maps. These maps show individuals' and groups' mental models and can support further investigation of causal connections.
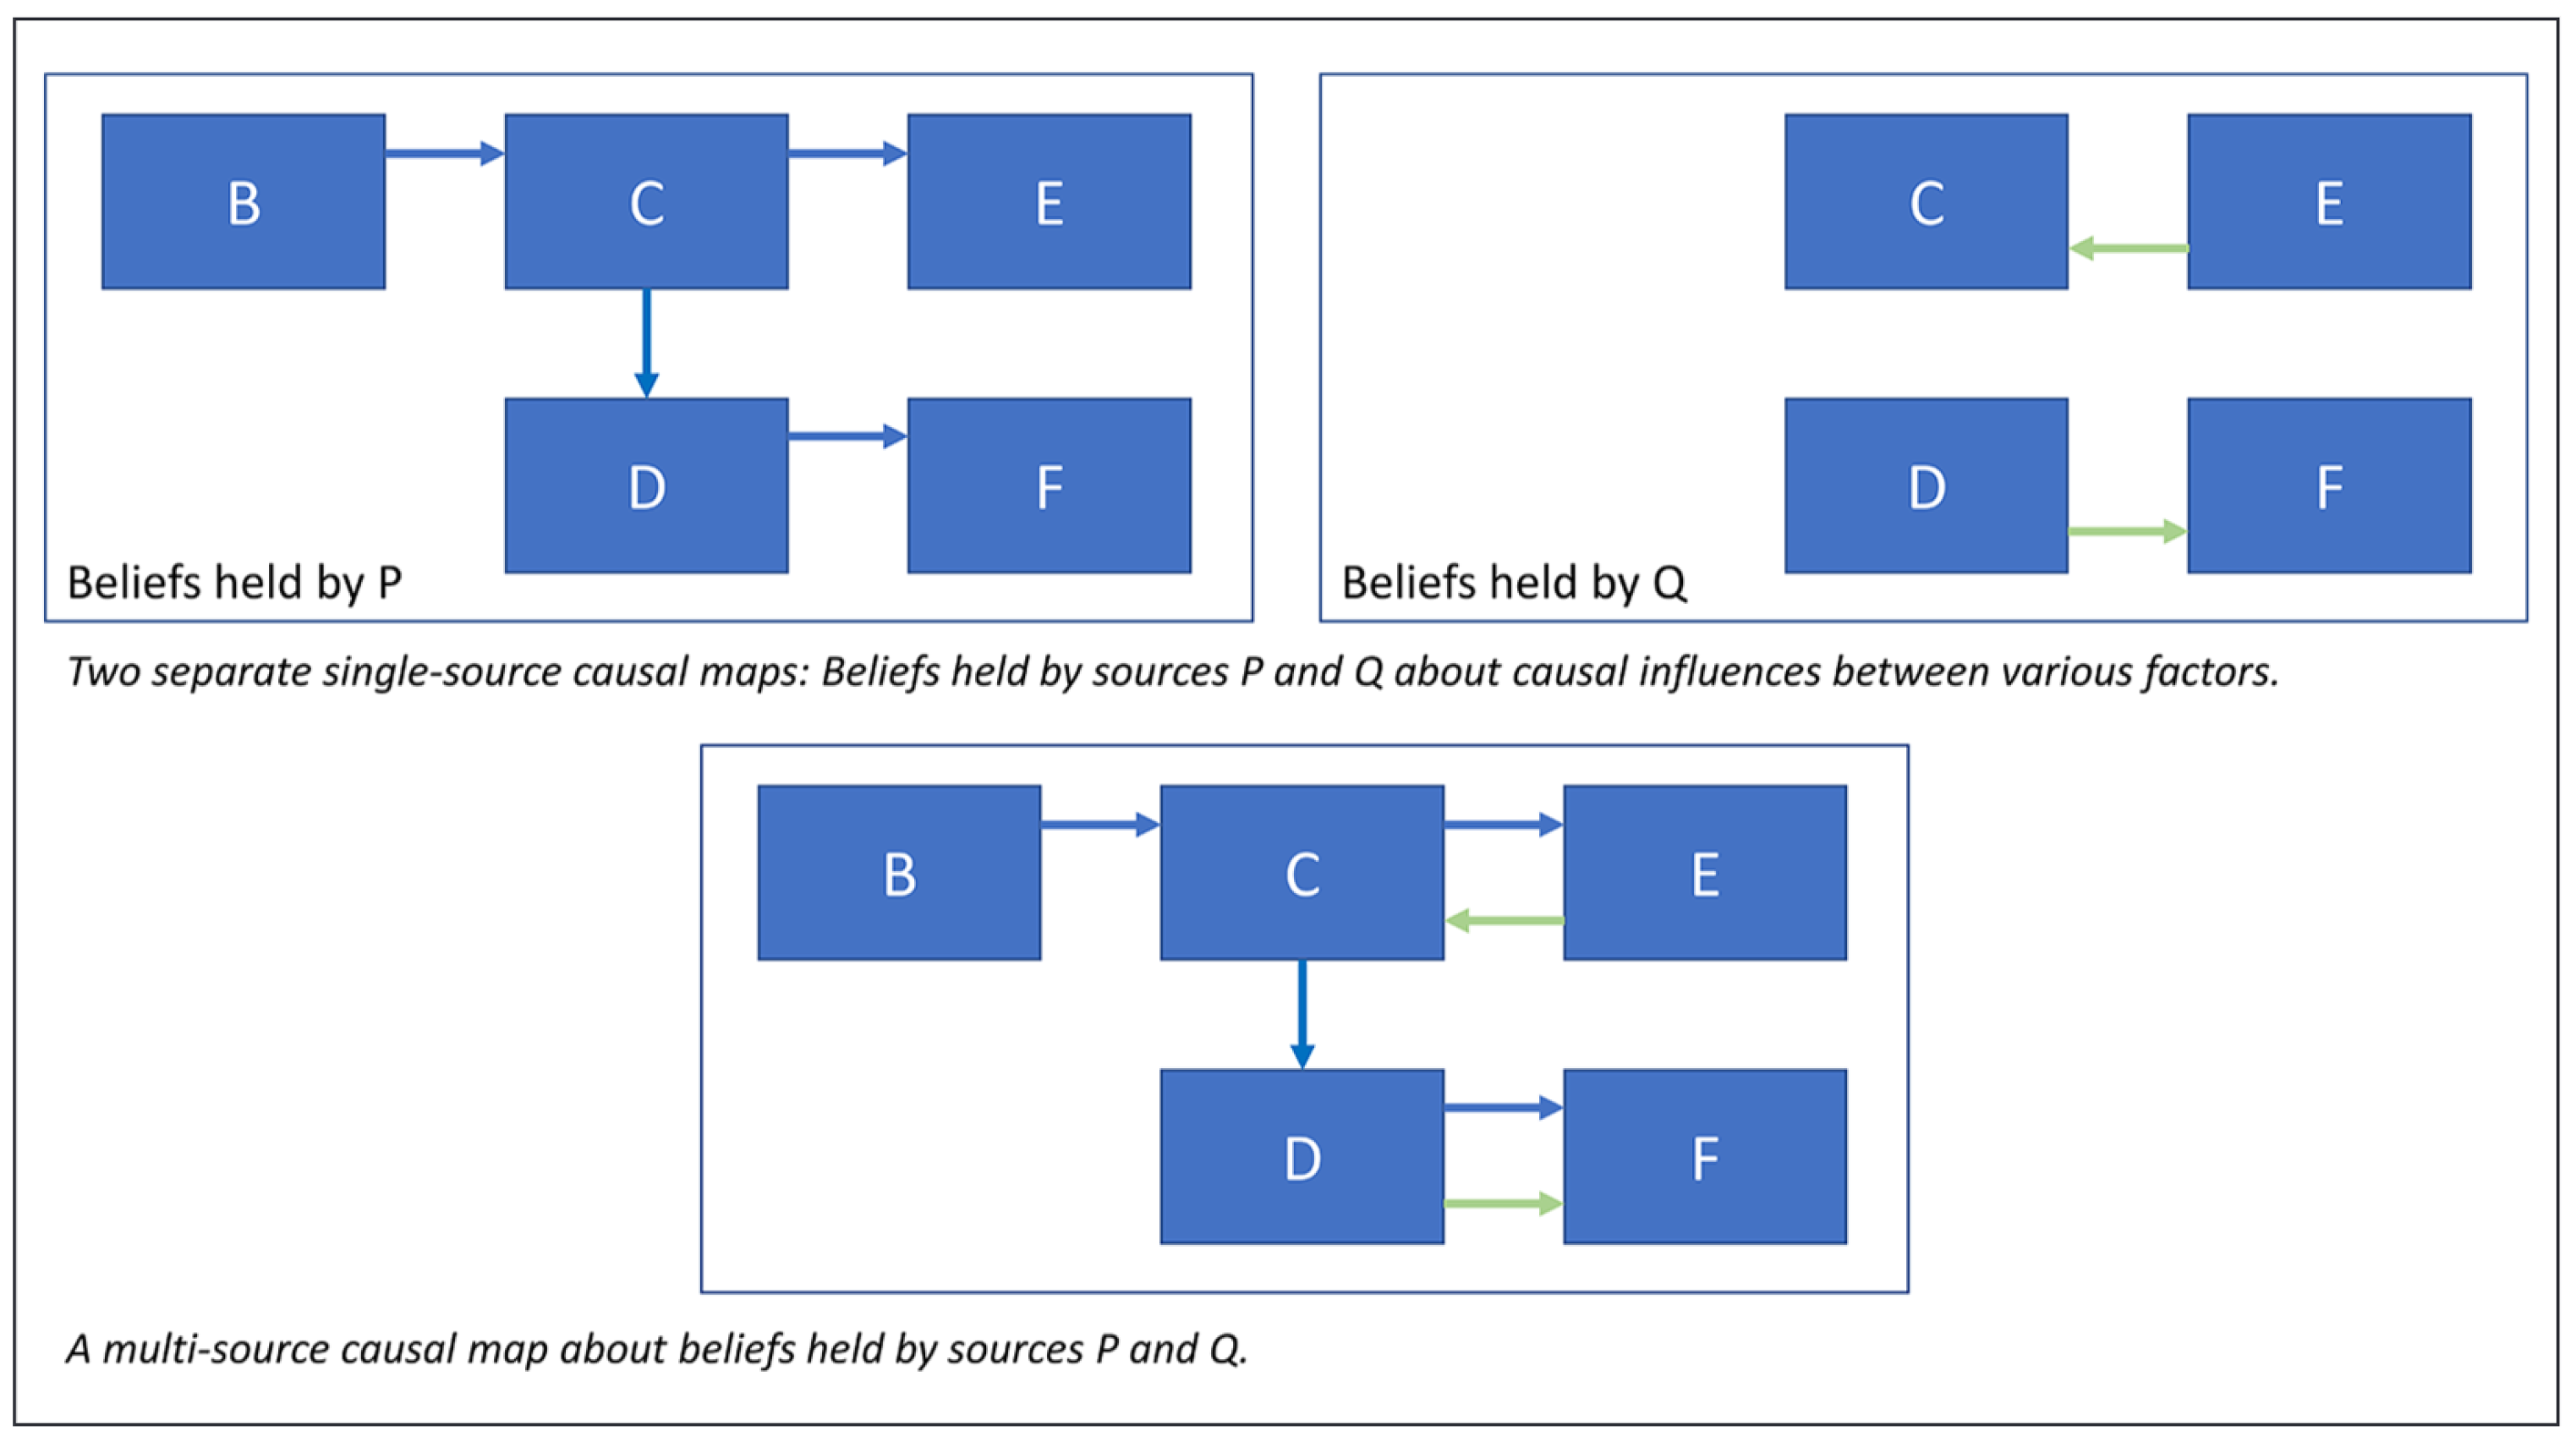
Top: two separate single-source causal maps: Beliefs held by sources P and Q about causal influences between various factors. Bottom: A combined, multi-source causal map about beliefs held by sources P and Q about causal influences between various factors
Causal mapping is designed for the analysis and visualisation of qualitative data about causal links. It can be used to test an existing theory of change or create collective empirical theories of change about how a program works based on stakeholders’ experiences.
People’s narratives and reflections about their experiences provide qualitative data that can be coded and displayed as maps to present the cognitive structures (mental models) of individuals and groups and to support further exploration to understand actual causal connections.
These causal maps can help to answer questions about what people think happened and what they think caused this by building links between different factors, such as different kinds of outcomes and inputs. Mapping the chains of results and their linkages builds pictures of causal pathways showing the intermediate steps and connections between them.